


Pandemic Properties
Which Locations Have Fared Best in the Property Market During COVID-19?
Since the COVID-19 pandemic first began to grip the world, very few aspects of our society have escaped its effects, and this is just as true for the property market. The market experienced a lot of rises and falls even before the virus appeared – since then, it’s been more unpredictable than ever.
Your home may be repossessed if you do not keep up repayments on your mortgage.
Exclusive broker partner to
Despite house prices staying fairly stable, property sales have dropped massively over the last year. But which of the UK’s towns and cities were hardest hit by the pandemic? And which locations saw the most sales?
We answered these questions in the latest study. Using government data, we calculated the property sale rates of over 120 towns in England and Wales and also compared how sales have changed in each location from 2019 to 2020. Read on to find out what we discovered…
Which Location Has the Lowest Property Purchase Rate?
Let’s begin with a ranking of English and Welsh towns and cities by their rate of property sales in 2020 (limited to locations that had more than 1,000 sales over the course of the year):
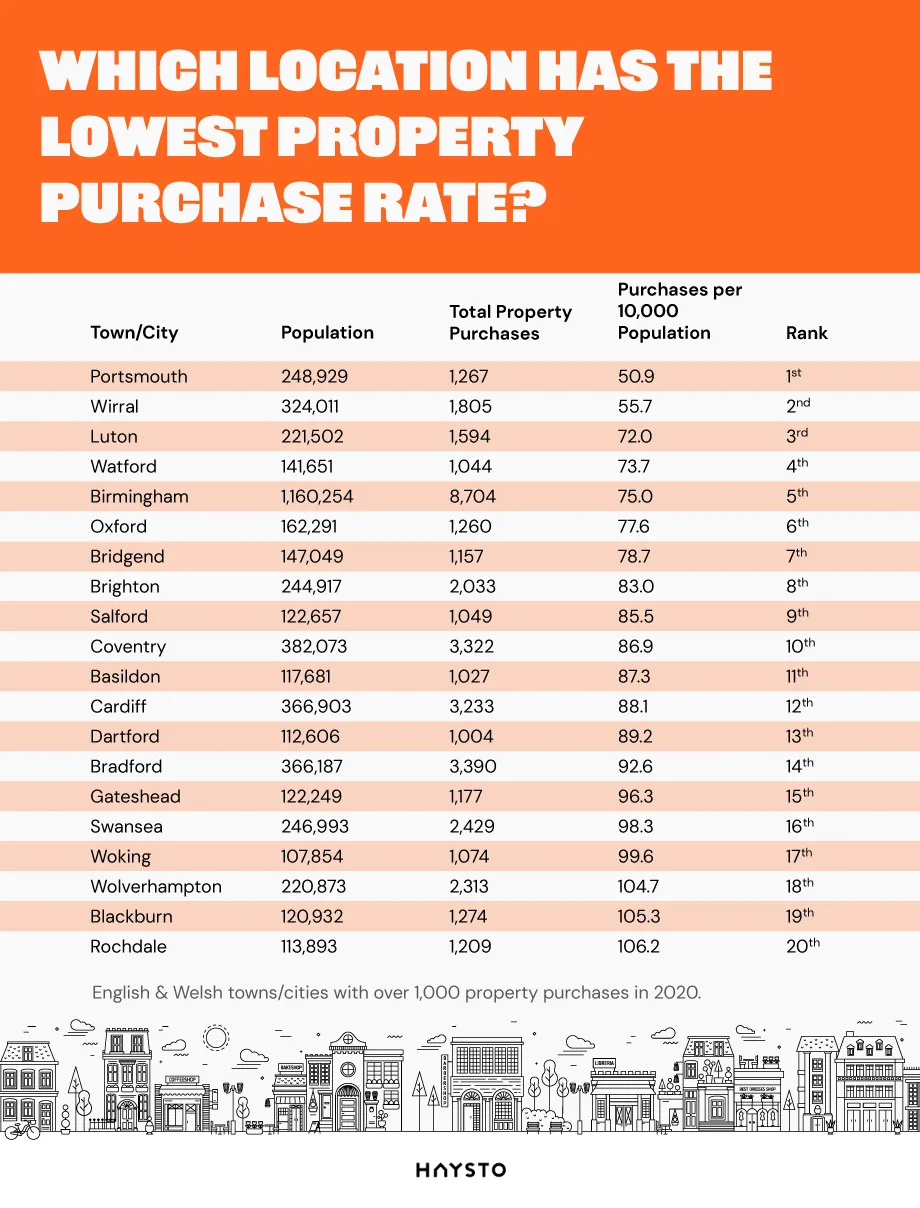
The location with the lowest rate of property sales in 2020 turned out to be Portsmouth, with only 50.9 property sales for every 10,000 residents. Despite having a population of nearly a quarter of a million, there were only 1,267 properties sold over the course of the year.
This isn’t the only time Portsmouth’s stood out in government research. A recent study found that the city is England’s second worst town for council home quality, with 38% failing to meet the Decent Homes Standard by the end of March 2020.
Birmingham came in 5th lowest, with only 75 property sales per 10,000 people (who, despite having a population over 1 million strong, only had 8,704 property sales in 2020), as well as Oxford in 6th with a rate of 77.6 and Cardiff in 12th with a rate of 87.3.
Let’s move on to the other end of the rankings to see which locations had the highest purchase rates:
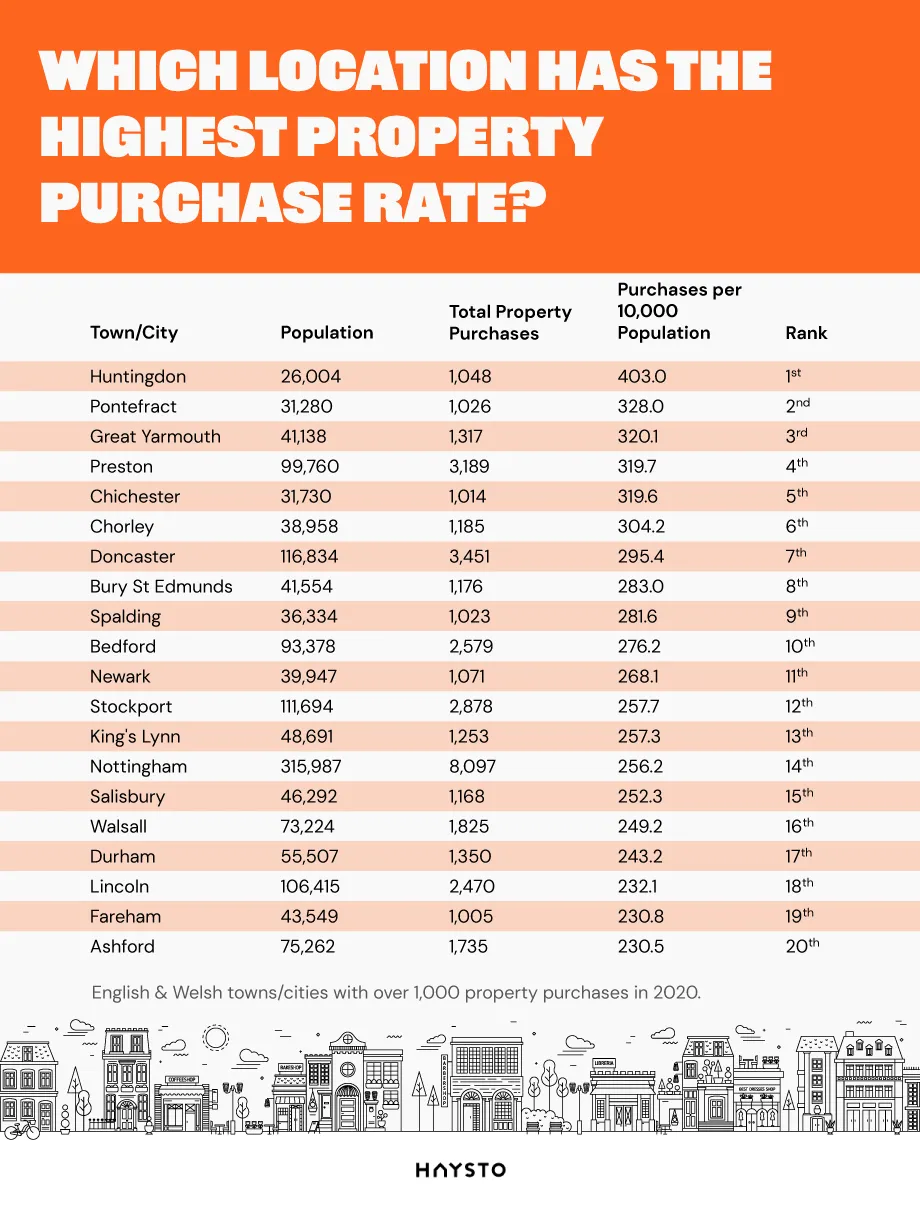
Many of the locations at this end of the ranking are actually a lot smaller than those at the other end – for instance, the town with the highest property sales rate is Huntingdon, with a population of only 26,004. In late 2020, it was reported that property prices were down 3% - this falling number could have contributed a lot to the location’s high amount of purchases.
Of course, this isn’t the case for every location on this ranking. Some larger cities made appearances: Doncaster came in 7th with a rate of 295.4 and a population of over 116k, while Nottingham came in 14th with a rate of 256.2 and a population of over 315k.
Which Location’s Property Purchases Were Hardest Hit by COVID-19?
Next, we wanted to find out how property sales have changed since the COVID-19 pandemic began.
Using the same government dataset as in our previous ranking, we quickly noticed that every location in the country saw a decrease in property sales from 2019 to 2020 (once again limited to those with over 1,000 sales in 2020). But which locations saw the biggest (and smallest) drops?
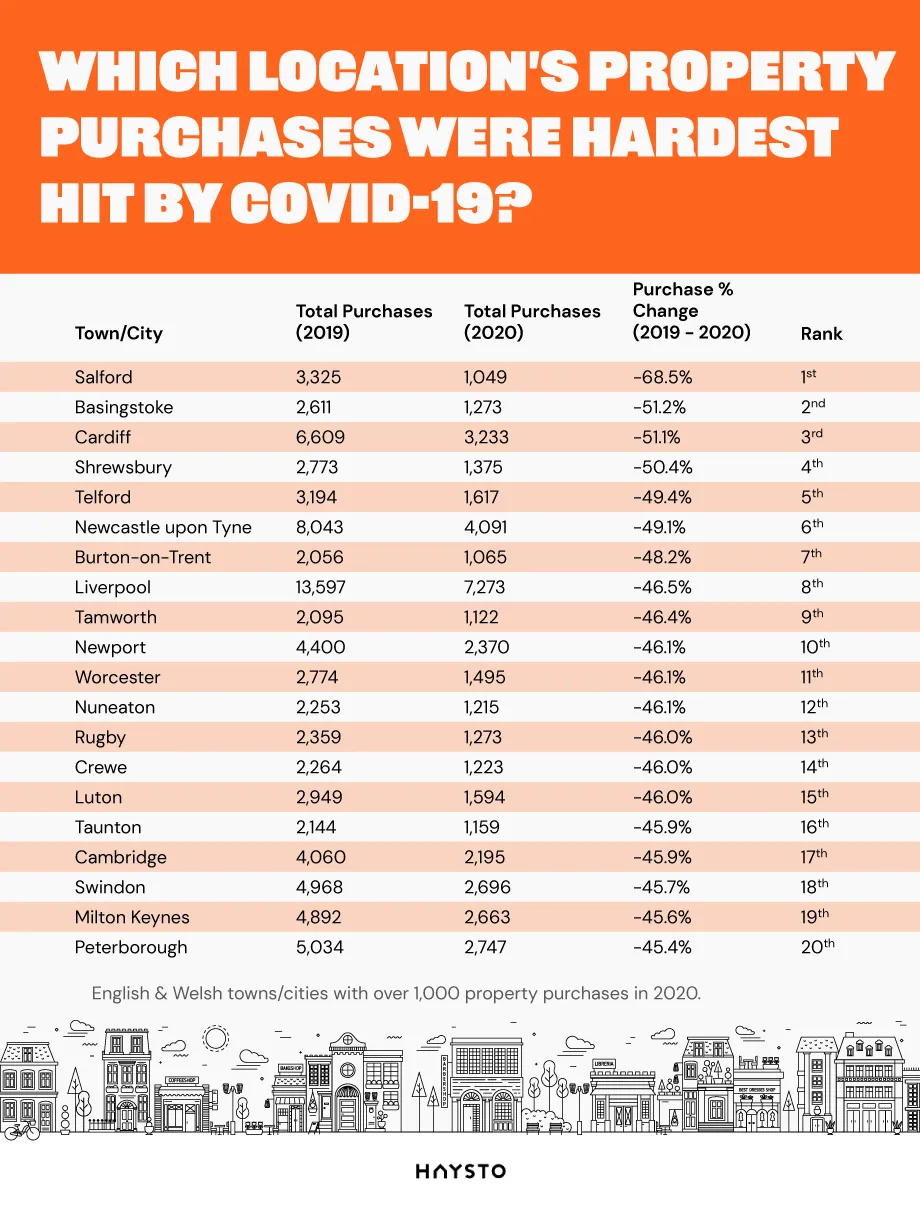
With a massive year-on-year drop of 68.5%, the location with by far the largest property sales decrease in 2020 was Salford. It fell from 3,325 sales in 2019 to only 1,049 in 2020 (a loss of over two-thirds) and, even more astonishingly, its decrease was over 17% larger than that of Basingstoke in 2nd place (with a drop of 51.2%). From that point on, the ranking becomes a lot more tightly packed: 2nd through 20th were all within the same 6% of one another, ranging from -51.2% to -45.4%.
Various English and Welsh metropoles appeared in this ranking, including Cardiff in 3rd (-51.1%) with its second high-ranking appearance in our study, as well as Newcastle in 6th (-49.1%) and Liverpool in 8th (-46.5%). Of course, it’s worth noting that having a small number of property purchases isn’t necessarily a bad thing.
When viewing the top ten hardest-hit locations on the map, it’s difficult not to notice that most of these cities are found in the North of England and Wales – the only Southern English town to appear here is Basingstoke, which finished in 2nd place:
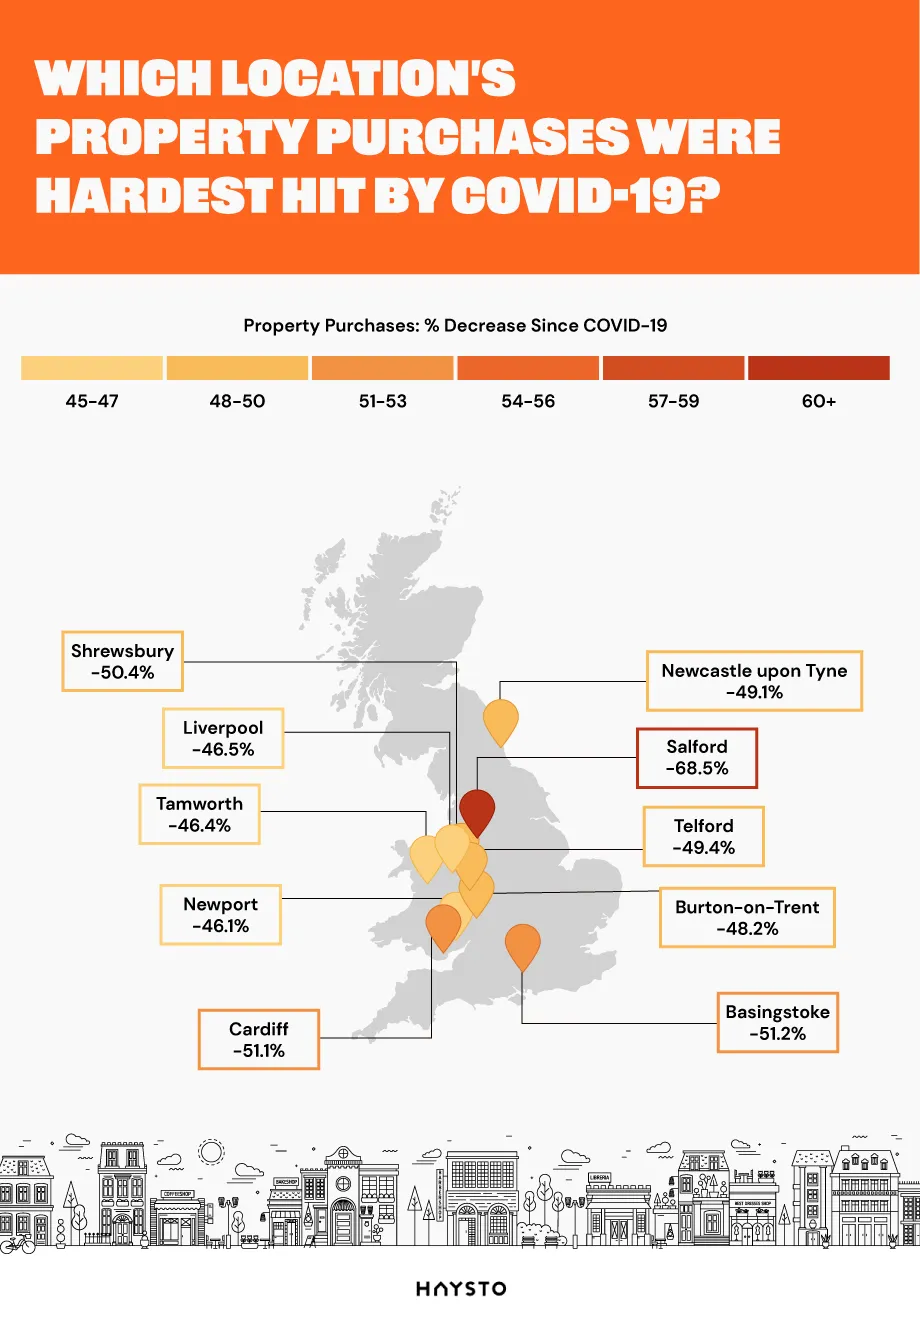
However, while some might argue that it suggests people aren’t interested in moving there, one shouldn’t forget that it also means people aren’t moving away – maybe they like the area and don’t want to leave!
Now let’s find out which towns and cities were least affected by the pandemic:
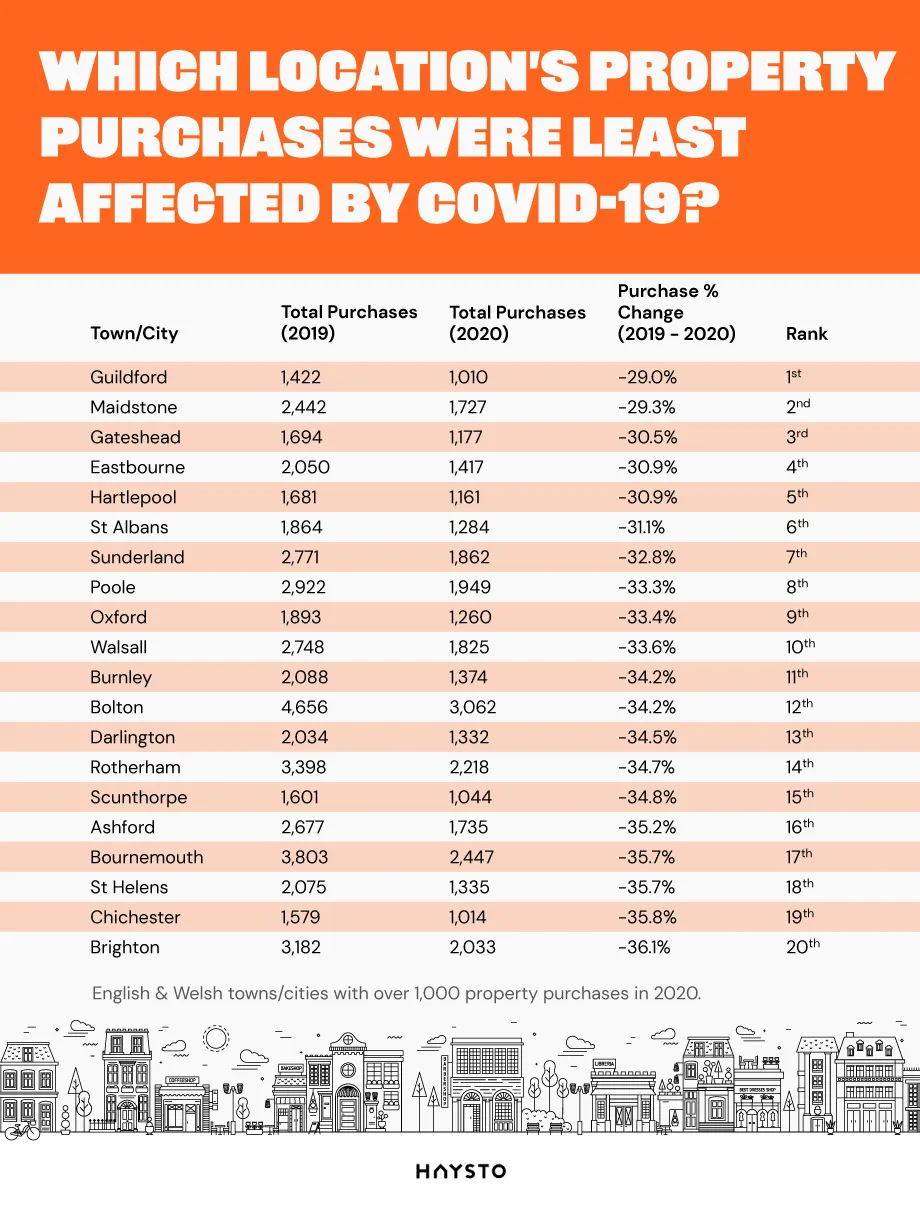
Like the towns in the previous table, every location saw a decrease in property sales from 2019 to 2020, and the locations least affected by COVID-19 were all very close in terms of the amount by which their purchases decreased. While Brighton in 20th place decreased by 36.1%, the town in 1st was Guildford with a decrease of 29% - resulting in a difference of only 7.1%.
This’ll be a good sign for Brighton’s residents; it’s great to see that it’s not all bad news for the seaside city (as was noted earlier in the study, it had the 8th lowest property purchase rate in 2020). This could develop into greater demand in the future, as it was recently reported that plans for a new housing estate are being reviewed by Brighton and Hove City Council.
Finally, let’s take a look at how property purchases have changed across the various parts of London since the pandemic first took hold:
Which London Boroughs Have Seen the Largest Property Purchase Drops Since COVID-19?
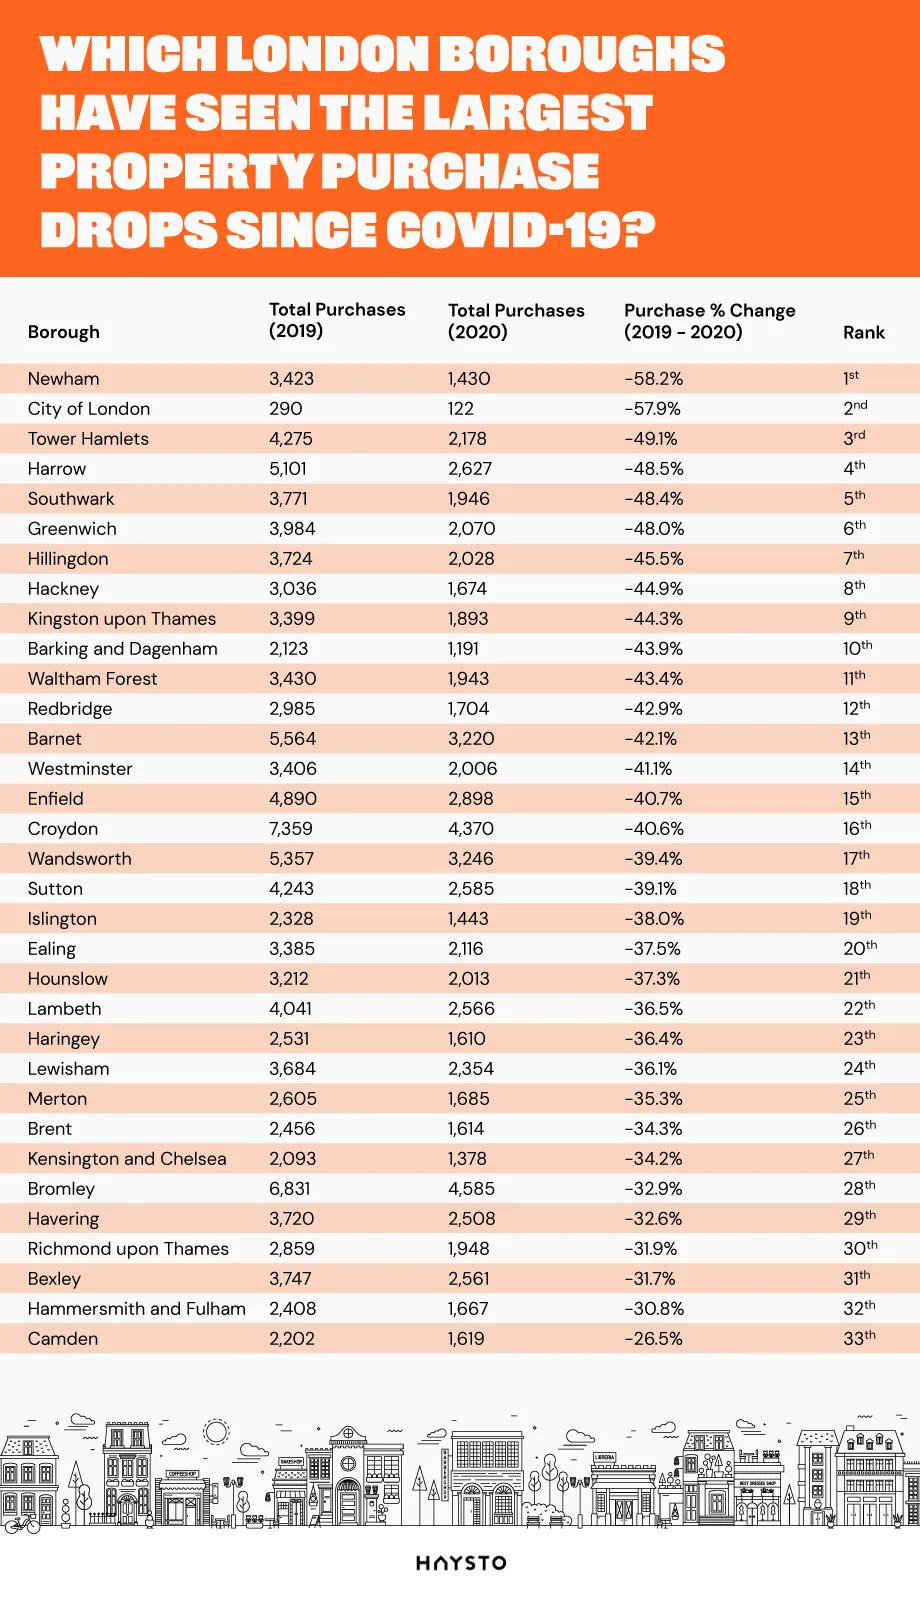
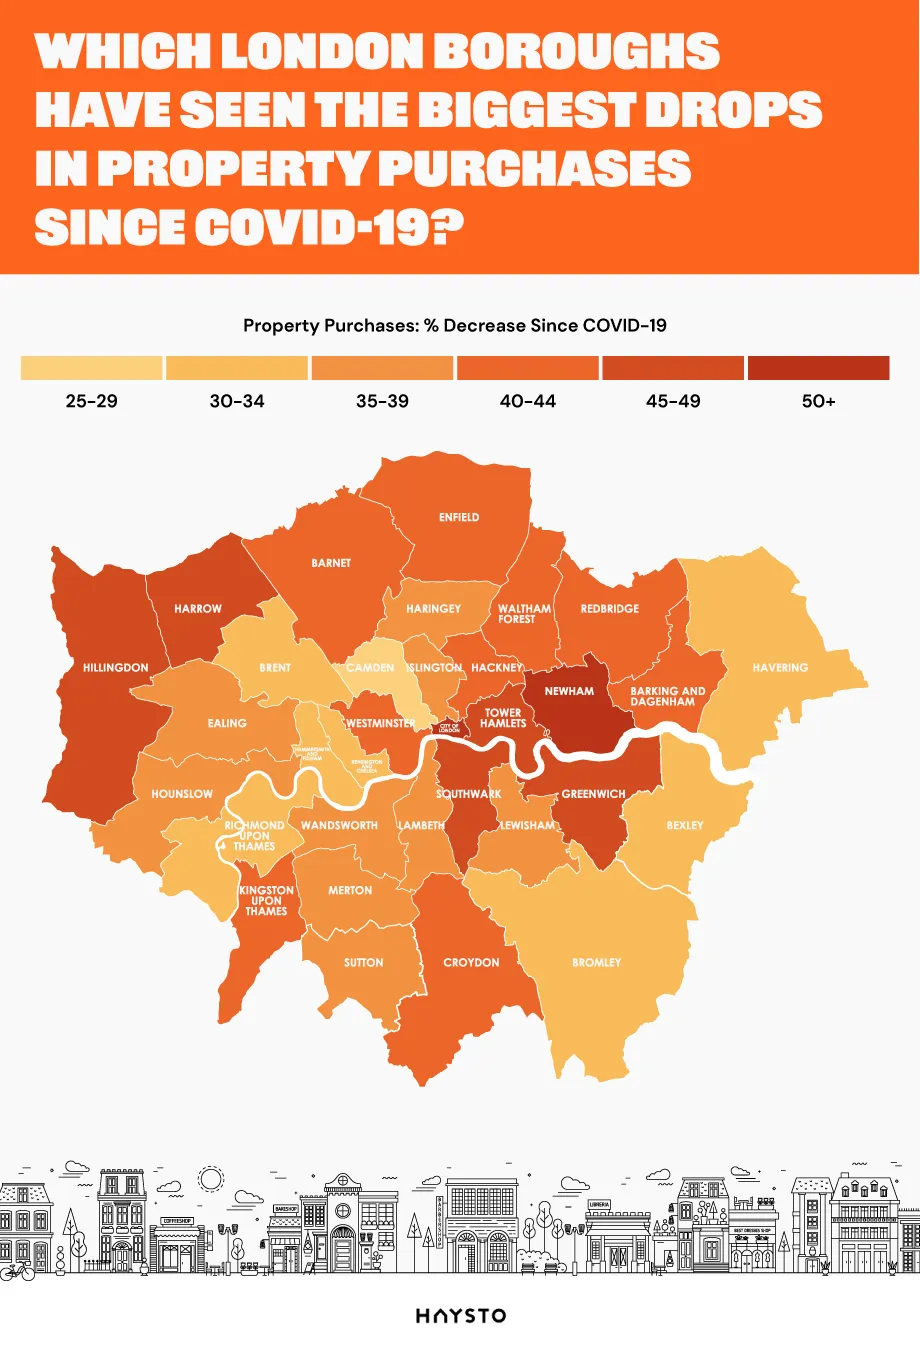
There seems to have been a lot of variation between London’s boroughs in terms of property sale decreases from 2019 to 2020. Newham - the hardest hit - saw a decrease of 58.2%, while Camden at the other end saw a drop of only 26.5%. Interestingly, government data shows that, while Newham has had one of the highest cumulative COVID-19 case numbers since October 2020 (with a total of 34,757), Camden has had one of the lowest (only 13,770).
Another notable result is the City of London’s placement in 2nd. It arguably makes sense to see areas near the city centre like this (and other boroughs such as Tower Hamlets, Southwark and Newham) experience property sale drops – the number of people working from home in the UK has increased hugely since the start of the pandemic, rising from 5.7% of workers in January/February 2020 to 36.5% in June 2020. This means far fewer people need to live in the city for work purposes.
It’s unsurprising that the pandemic has affected property sales since it appeared in early 2020. The virus has caused far-reaching repercussions across the world, with very few people unaffected. Still, it’s intriguing to see the effects on the different regions of our country.
Paul Coss, Co-Founder of Haysto, commented on the findings:
“The impact of COVID-19 changed the property market in 2020 nationwide. I believe when we come out of lockdown and the economy starts to bounce back, this could be a good year to move or get on the property ladder. Lenders are launching new mortgage deals to encourage people to move with more flexible lending criteria.”
If you’d like to view the dataset in greater depth, click here.
Sources
Information
Tools & Guides

Haysto, a trading style of Haysto Ltd, is an appointed representative of HL Partnership Limited, which is authorised and regulated by the Financial Conduct Authority.Registered Office: Haysto, Crystal House, 24 Cattle Market Street, Norwich, NR1 3DY. Registered in England and Wales No. 12527065
There may be a fee for mortgage advice. The exact amount depends upon your circumstances, but will range from £649 to £1699, and this will be discussed and agreed with you at the earliest opportunity.
The guidance and/or information contained within this website is subject to the UK regulatory regime and is therefore targeted at consumers based in the UK.
Your home may be repossessed if you do not keep up repayments on your mortgage.